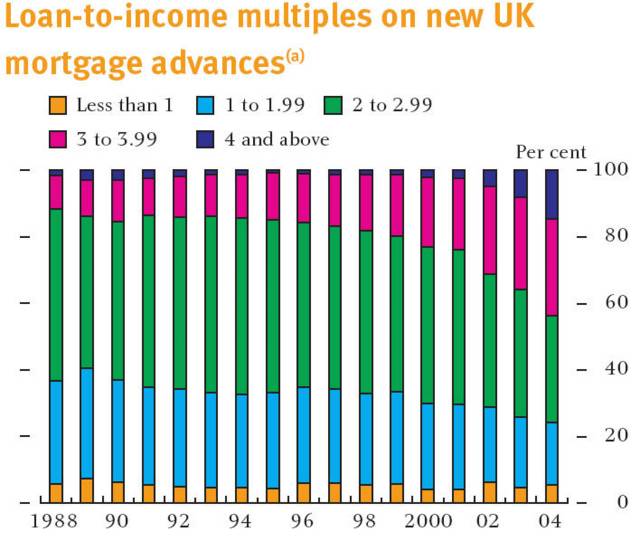
The Bank of England has just published its Financial Review, a bit like an end of year school report on the nation, and buried in its zillions of pages is the chart showing the size of mortgages as a ratio of the personal income. Stop yawning.
Why might this be of interest you might think? Well look at the difference between 1988 and 2004 and you will see that four times income represented a tiny number of mortgages, whereas now it is not far short of 20%. Today, the majority of mortgages, give or take a few points, are granted on 3 and above times income.
So what you might think. If; no when, we have an economic downturn the vulnerability to mortgage debt is much higher. Link this with the record levels of credit card debt and you have the ingredients for a major slump in consumption of all consumers but especially the younger ones. I bet this analysis doesn’t appear in too many marketing plans. Dick Stroud: www.20plus30.com
Bank of England data

No comments:
Post a Comment